Stock Market Calendar for Stock Investors
The Stock Market Calendar is a great reference for every investor as a quick reference guide to glance over before a typical stock market month and what to expect in the current year.
|
The market oscillates up and down based on many factors, but over
several years of study, history does tend to repeat itself more often
than not. I'm about to hand you over a couple ready references that you can print out and frame if you'd like. All I ask is that you subscribe to my Stock Market Hacks Newsletter and utilize these two tools every day when you sit down to research stocks or make a trade. These are here to help you become better stock market investors. |
 |
Stock Market Calendar for the Year Ending in...
History repeats itself, year after year. Not exactly, but close. Over the last three decades, people have retraced over the prices of stock and the market to see the overall sentiment of the years. I've also looked back and confirmed all of the findings that lead to the creation of this very helpful trading calendar. It gives you a summary of what can be expected if the year you are entering ends in a certain number.
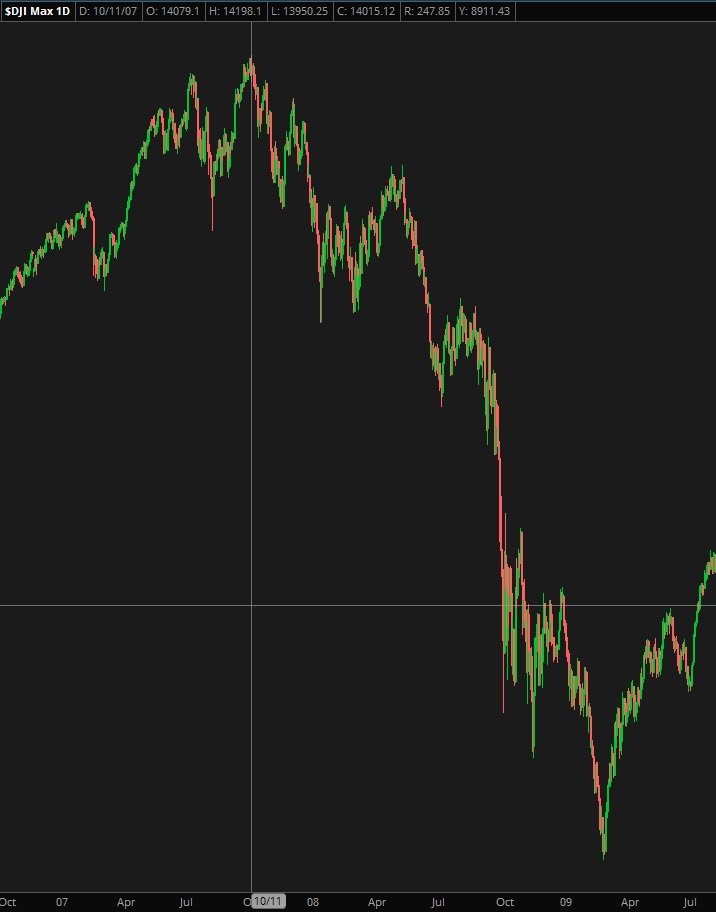
For instance, a year ending in seven (7) is typically a year that starts off as a bull market and becomes very choppy with larger up and down swings. It is the year you can expect a hard sell-off often considered a crash or severe correction.
This could have happened in 2017, and if things went differently in the election, there probably would have been a very serious economic collapse effecting stocks world wide.
So, this calendar isn't a crystal ball, but if you look back at 2007, the Dow Jones Industrial Average started getting very choppy in May of 2007. In October of 2007, it hit a high of around 14198 and started going down until it hit a low of around 12720 by November 26th. This was a drop in about 2 months of about 1,478 points. It sprouted back up for a couple of months, then continued a long term downward trend to the low point 6469.95 on March 6, 2009. This was considered a crash because it dropped 7,728 points (over 50%).
This Great Trading Calendar is Yours Free - Just for Subscribing Below
|
I definitely won't miss the next crash. And since it didn't happen in 2017, your guess is as good as mine. |
Stock Trading Calendar by Month
Another great reference that I'm going to give you breaks down the calendar year by month, explaining all of the events that happen throughout the year such as earnings seasons, warning seasons, when to look for a rise in stocks, and when to look for heavy profit taking.
This stock market calendar would have told me exactly when to get out of the market. Unlike the Yearly outlook that gives a summary of what the market should be like throughout the year, it is more specific and is a good gauge when to look for stocks to buy and when you should not be in the market.
This 2nd Great Trading Calendar is Yours Free - Just for Subscribing Below
Subscribe to Stock Market Hacks Newsletter
To protect your computer from viruses, the stock market calendar files were scanned with the latest version of 360 Total Security and Spybot Search and Destroy 2.6.
By subscribing, you agree to our Privacy Policy, Terms of Service, and Disclaimer.
I hope you take advantage of these two stock market calendar references I'm handing you. I'm sure they will help you with your future investment decisions. If anything, they will provide a buffer of caution and insight into what to expect in the near future.


New! Comments
Have your say about what you just read! Leave me a comment in the box below.