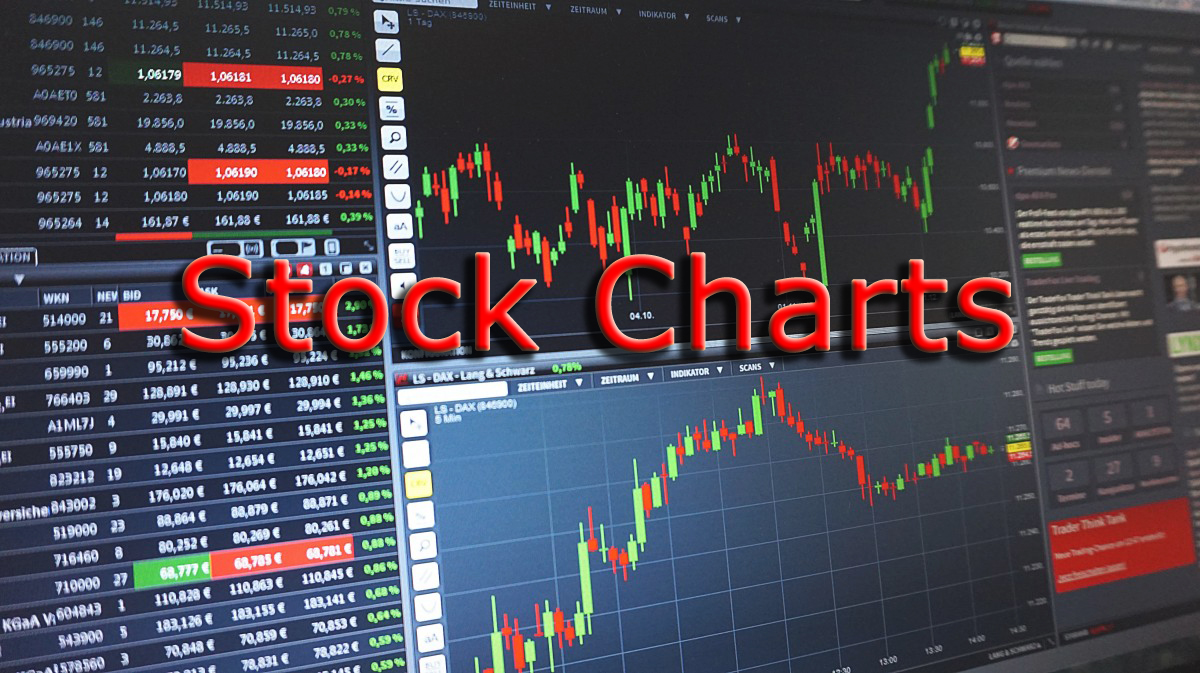
Stock Charts Show You the Big Picture
Stock charts enable all levels of investors to see many pieces of information that can be used to make a determination of buying or selling a stock or option. If a stock is traded publicly in the stock market, you can pull it up on your chart to see if it is in a good position to buy, sell, or if you should hold or wait.
The primary purpose of the chart is give you a quick picture of stock price over a period of time. It can be as simple or complex as you need to determine important information about the stock and how it is doing on a daily, weekly, and monthly basis.
Figuring out whether to buy or sell a stock can be easily incorporated in your charting system with a few stock market indicators and stock trading strategies. Before you make any move on a stock, you should first consult the chart.
Basics of Stock Charts
All stock charts incorporate price over a chosen period of time. Good charting systems show you the low price for the day, the high for the day, the open, and close price. The period of time can be extended to see weekly change or monthly change. It can also be shortened to see movement throughout the day down to the minute.
Unless you are day trading, you should be looking at charts with daily and weekly prices. They can be displayed as a simple line, a candlestick, or bar charts. Candlestick and bar charts show the trader more information for the time period than a simple line chart, so it is recommended to use a candlestick or bar chart to show price of the stock.
Another feature of most charts is volume, which shows the amount of stock that was traded over a period of time. It can be positive for more buying or negative for more selling action of the security.
If the price and the volume are both going up (or positive), it shows an upward trend in the stock. Or if both are going down (or negative), it shows a downward trend.
Advanced Charting
There are many tools or indicators that can be incorporated into stock charts that will help you determine important information about the stock. Though there are too many to list here, some of the more important stock market indicators are presented on the Stock Market Hacks to help determine key signals (buys, sells, or hold).
Properly set up and understood, a chart with price, volume, and three or four indicators can establish a great system of stock trading that can help you jump ahead of other investors.
Recommended Charting System
One of my favorite charting systems I personally use is available for free through TD Ameritrade and is called thinkorswim(R). This real time charting and trading system is very powerful and will help you establish a good trading strategy that you can use every day to find stocks, trade in and out of stocks, and track you current investments. It can help you do research as well as analysis of stocks. It's a great learning tool and application tool.
There are many more stock chart programs out there, but this is the most versatile and useful (and least expensive one) that I can find. I highly recommend trying it out. You won't be sorry.


New! Comments
Have your say about what you just read! Leave me a comment in the box below.