Candlestick Signals are Great Trade Indicators
Candlestick signals in charting have been around since the mid 1800s, representing a one of the oldest and still used today indicators of the stock market. There are 42 simple and complex patterns that can be used to signal trend shifts in a stock price or in some instances, when to buy or sell a stock.
Trying to memorize every pattern is near impossible and you are bound to make a mistake when looking at your charts. Some of the patterns are obvious and stick out while others are more difficult to determine.
The best approach to reading candlestick signals is to commit about five patterns to memory and look for them every time you look at your charts. When one of these signals appears at the end of the day, it could be telling you that the price is going to reverse.
Learn the Easiest Candlestick Signals to Recognize
When you first bring up a chart for a stock, you should be able to see a candlestick pattern jump out at you immediately. Once a candle closes, it is set in stone for the time frame you are looking at.
In the evening when you are doing your research, you will see the last candle and preceding candles in your chart. These are the ones you want to pay attention to the most.
There are several other patterns that utilize the future candles (that you can't see yet), but you should use these as verification of your decision based on current patterns.
Anatomy of the Candlestick
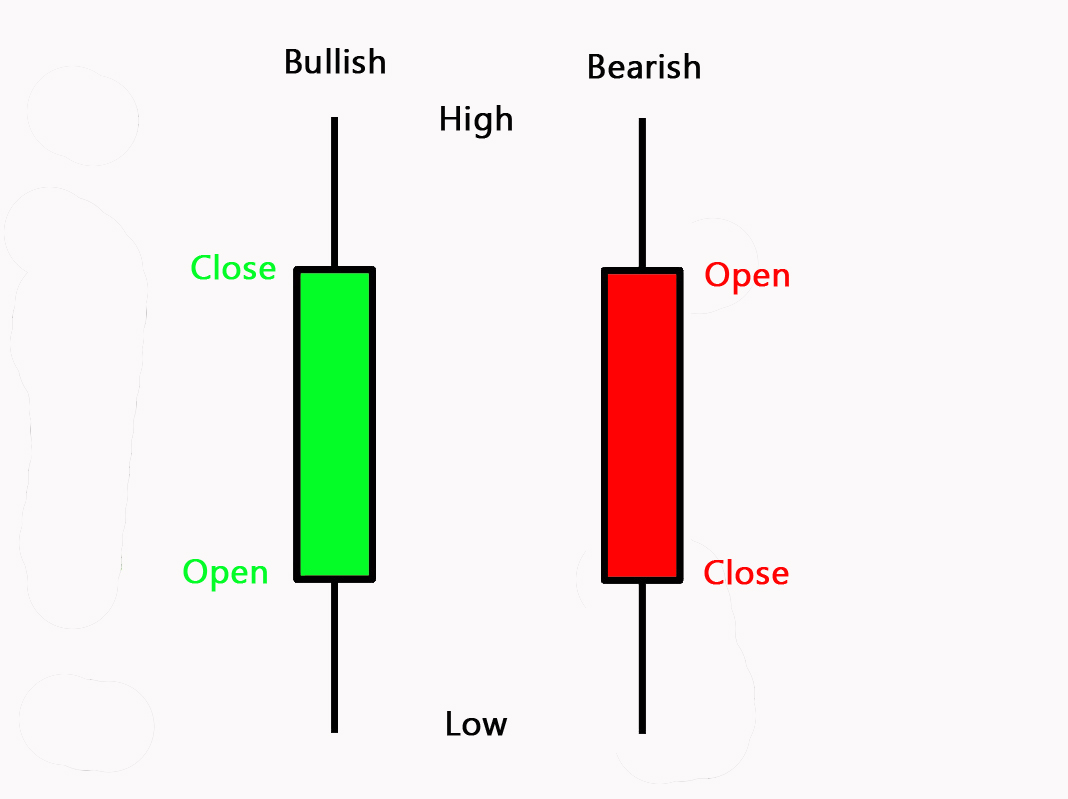
First, you need to know the anatomy of a candlestick. All candles look about the same, but depending on their color and layout, each tell you a different thing about the price that day.
As you can see from the image above, bullish candlesticks open low, push lower, push higher than the close, close higher than the open and are green in color. The lines that push above and below the body of the candle are called "shadows".
Bearish candlesticks open high, push higher than the open, then push lower than the close while closing lower than the open. The bearish candles are red in color.
Some candles you will see are absent in color and generally open and close at the same price but push up or down during trading.
The Easiest Candles to Spot
When looking for trend reversals or when to buy and sell a stock, you don't want to have to spend hours analyzing each stock; you want to spend about two minutes or so on each so you can get on with your day.
The below candlestick signals have been chosen because they are easy to spot and easy to memorize. You don't want to think about the signals - you want to know them right away.
Commit the following candlesticks to memory so you can quickly decide if a trend is changing directions.
The Doji Candlesticks
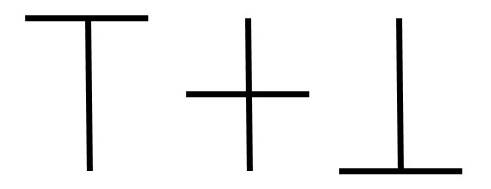
The first candlestick signals you will be looking for are called doji candlesticks. There are three of these easy to spot indicators that are probably the most important of all candlesticks (because they are so easy to spot).
A Doji is created when the opening price and the closing price are the same or very close to the same. There may be a run up and down, but open and close are the same, thus the lower case "t" looking shape.
A Dragonfly Doji is developed when the opening and closing are the same, but this occurs at the highest price for the day. It has a long shadow under the open and close so it looks like a capital "T". When this doji forms, and when it appears at the bottom of a bearish trend, it is signaling a reversal in the upward or bullish direction.
A Gravestone Doji is seen when the open and close prices are the same, but at the lowest point of the day. The price makes a run up but settles back at the beginning. When this candle is seen at the end of a bullish trend, it signals a reversal in the downward or bearish direction.
These three candlestick signals are the most important to watch out for because they are easy to spot and are correct most of the time.
The Hammer
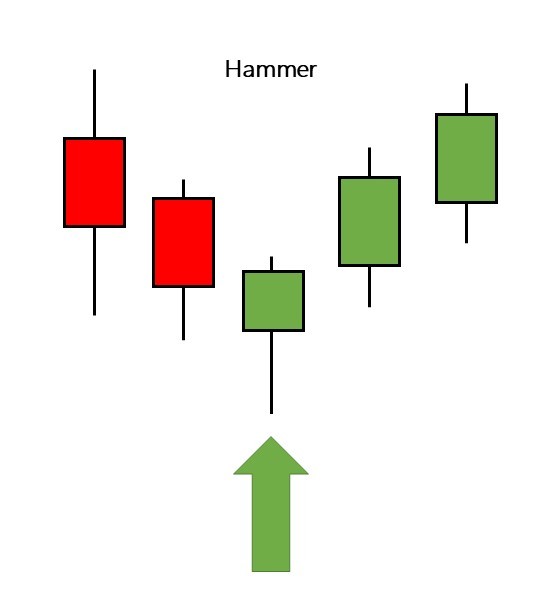
The Hammer comes with many names, but essentially is the same shape. There are four types of hammers that are easily recognizable and can be used as buy/sell signals or reversal indicators.
If the "hammer" (a small candle body) is at the top with a slight upper shadow and a long shadow at the bottom, it is considered a bullish or upward signal during a downtrend.
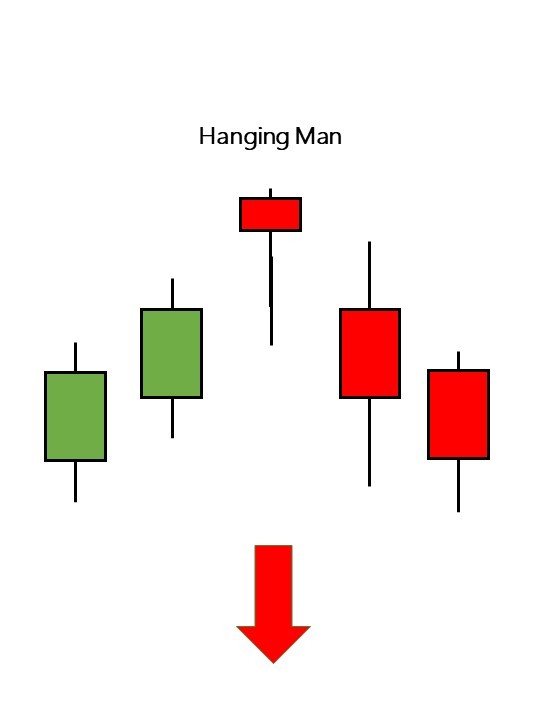
If the hammer is at the end of an uptrend, this is called a Hanging Man and is a reversal in the downward direction.
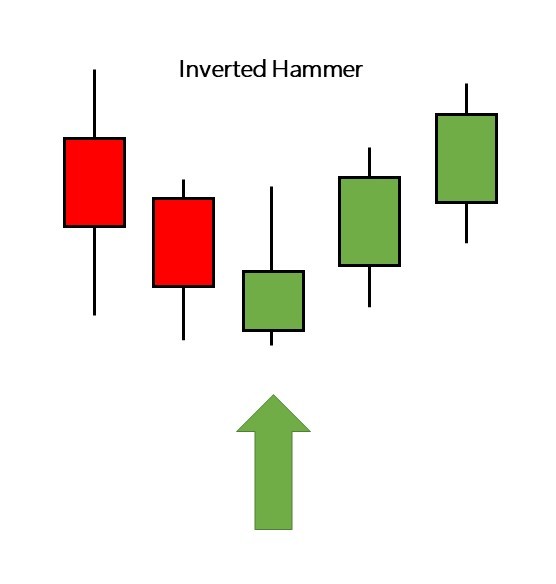
If the hammer is at the bottom of the candlestick (inverted) with a long shadow up and very short low price, it's called an Inverted Hammer. It is considered a bottom reversal to the upward or bullish direction.
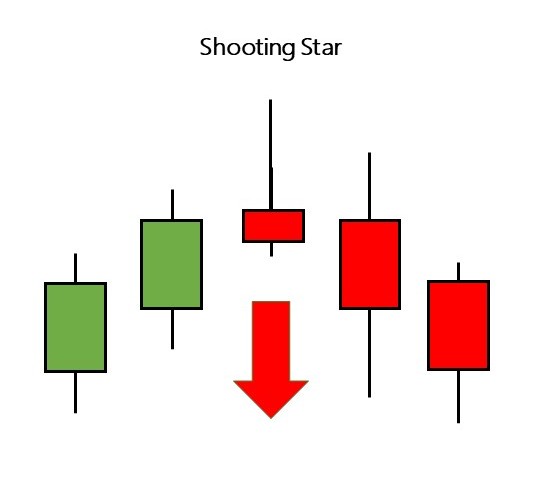
If the Inverted Hammer is at the top of an upward trend, it is called a Shooting Star and indicates a reversal in the downward direction.
The Continuation Candle
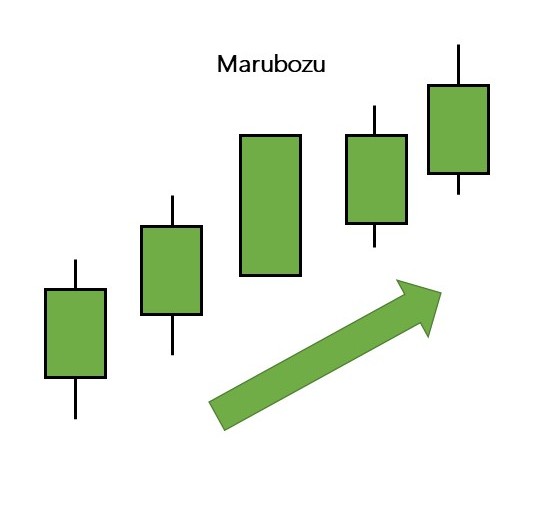
The last of the candlestick signals to look out to see if a trend is continuing is called the Marubozu, which is a long or normal sized candlestick but with the opening and closing as the high or low. The color of the candle depends on if it closes high (green) or closes low (red).
The colors don't matter in this candle as it is telling you that the current trend is going to continue a bit longer. It works in up, down, and sideways trends.
There are several additional candlestick patterns to learn, but for now, these are the ones you should commit to memory and look for on a daily basis. They have been used for over a hundred years and are quite accurate, but always back up your decisions based on additional evidence from other studies, patterns, and indications.

New! Comments
Have your say about what you just read! Leave me a comment in the box below.